The $124 Trillion Inheritance America May Never Collect
The defining financial story of the next two decades is not a wealth transfer — it is a wealth collision.
An estimated $124 trillion will change hands between generations through 2048, but that headline figure obscures a darker arithmetic: long-term care costs consuming estates before heirs inherit, a caregiving workforce in crisis, and entitlement systems hurtling toward insolvency just as demand peaks. This report compiles the most current data (2024–2026) across all three dimensions — generational wealth transfer, care costs, and social system solvency — to provide the factual foundation for understanding what lies ahead.
Section 1: The Great Wealth Transfer Has Grown to $124 Trillion
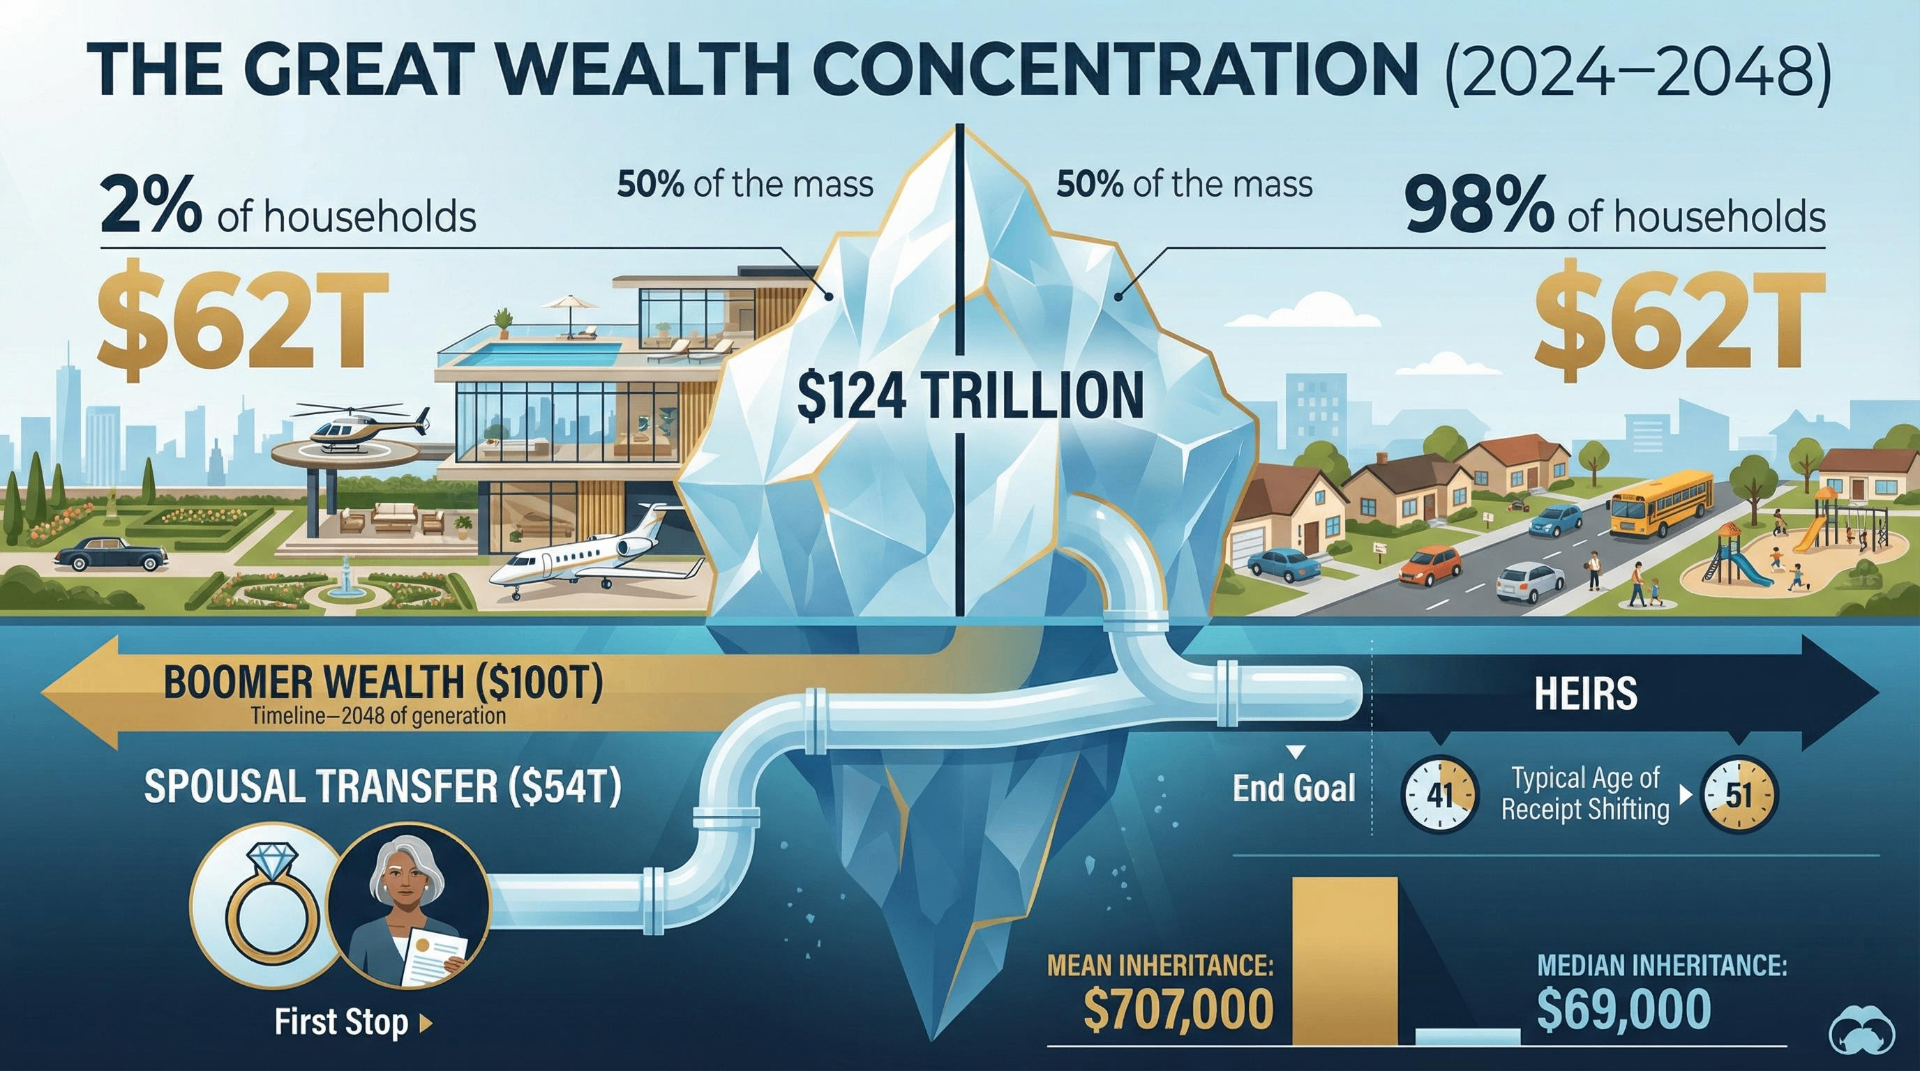
The widely cited "$84 trillion" figure is outdated. In December 2024, Cerulli Associates revised its projection sharply upward to $124 trillion in total wealth transfers through 2048, with $105 trillion flowing to heirs and $18 trillion to charity. The original $84.4 trillion estimate was published in January 2022 in Cerulli's U.S. High-Net-Worth and Ultra-High-Net-Worth Markets 2021 report and projected transfers through 2045. Three factors drove the 48% revision, per Cerulli's October 2025 white paper "Unpacking the Great Wealth Transfer": inflation adjustment (converting 2020 to 2023 dollars yields ~$100T), outsized asset growth (equities up 27%, real estate up 39% since 2020), and greater wealth concentration in older households (61% of wealth held by those 60+ in 2023, up from 54% in 2020).
Nearly $100 trillion of the $124 trillion will come from Baby Boomer and older households — 81% of all projected transfers. Half of the total ($62 trillion) originates from high-net-worth and ultra-high-net-worth households, which represent just 2% of all U.S. households. Millennials stand to inherit the most over 25 years at $46 trillion, but Gen X inherits the most in the next decade at $14 trillion versus $8 trillion for Millennials in the same window. Gen Z is projected to receive $15 trillion over the full period.
A critical but underappreciated dynamic: $54 trillion will first pass horizontally to surviving spouses before eventually moving intergenerationally. Roughly $40 trillion of those spousal transfers will go to widowed Baby Boomer women, further delaying when younger generations actually receive wealth.
Boomers Hold Over Half of All U.S. Household Wealth
Federal Reserve Distributional Financial Accounts data (Q1 2025, released January 16, 2026) show Baby Boomers holding 51.4% of total U.S. household wealth — approximately $85–88 trillion out of a national total of $176.3 trillion (Q2 2025 Fed Z.1 release). Gen X holds roughly 26% (~$43 trillion), while Millennials and Gen Z combined hold just 10.3–10.7% (~$17–18 trillion). The Silent Generation and older account for the remaining ~12%, declining rapidly.
Apollo Global Management's chief economist Torsten Slok noted in December 2025 that Americans over 70 now hold 31% of household sector wealth, up from 19% in 1989. Meanwhile, Gen Z — despite having a comparable population share — holds only about $6 trillion total.
The composition of Boomer wealth matters for understanding what ultimately transfers:
| Asset Category | Approximate Value | Share |
|---|---|---|
| Equities and mutual funds | $25.15 trillion | ~29% |
| Real estate (net of debt) | $19.68 trillion | ~23% |
| Pension entitlements | $16.21 trillion | ~19% |
| Private businesses | $7.73 trillion | ~9% |
| Consumer durables | $3.04 trillion | ~4% |
| Other assets | $14.91 trillion | ~18% |
Boomers hold 54% of all U.S. equities, worth more than $25 trillion. The heavy pension component ($16.2T) is largely non-transferable, meaning much of the headline wealth figure will never reach heirs.
Most Americans Will Never Receive a Meaningful Inheritance
The inheritance landscape is profoundly unequal. Only about 20% of U.S. households have received an inheritance at any given time, a figure that has remained flat for 30 years per United Income (now Capital One) analysis. Over a full lifetime, roughly 30% of households can expect to receive some form of wealth transfer. The racial gap is stark: 30% of White survey respondents in the Fed's Survey of Consumer Finances reported receiving an inheritance, compared to 10% of Black respondents and 7% of Hispanic respondents.
The gap between mean and median inheritance reveals extreme skew. Among those who receive an inheritance, the median is approximately $69,000 while the mean is $707,291. The top 1% by wealth report average lifetime inheritances of $2.7 million, while the bottom 50% average just $9,700.
A stark expectations gap exists: only 22% of Boomers expect to leave their children an inheritance, while 38% of Gen Z and 32% of Millennials expect to receive one.
Inheritance Arrives Decades Too Late to Matter Most
The average age of inheritance receipt has risen from 41 in 1989 to approximately 51 in recent data. More than 25% of all bequests now go to adults age 61 or older. This timing means Gen Xers will typically receive Boomer wealth in their 50s and 60s, and Millennials in their 50s through 70s — well past the life stages when capital could fund education, homeownership, or business formation. The $54 trillion in spousal transfers identified by Cerulli compounds this delay further.
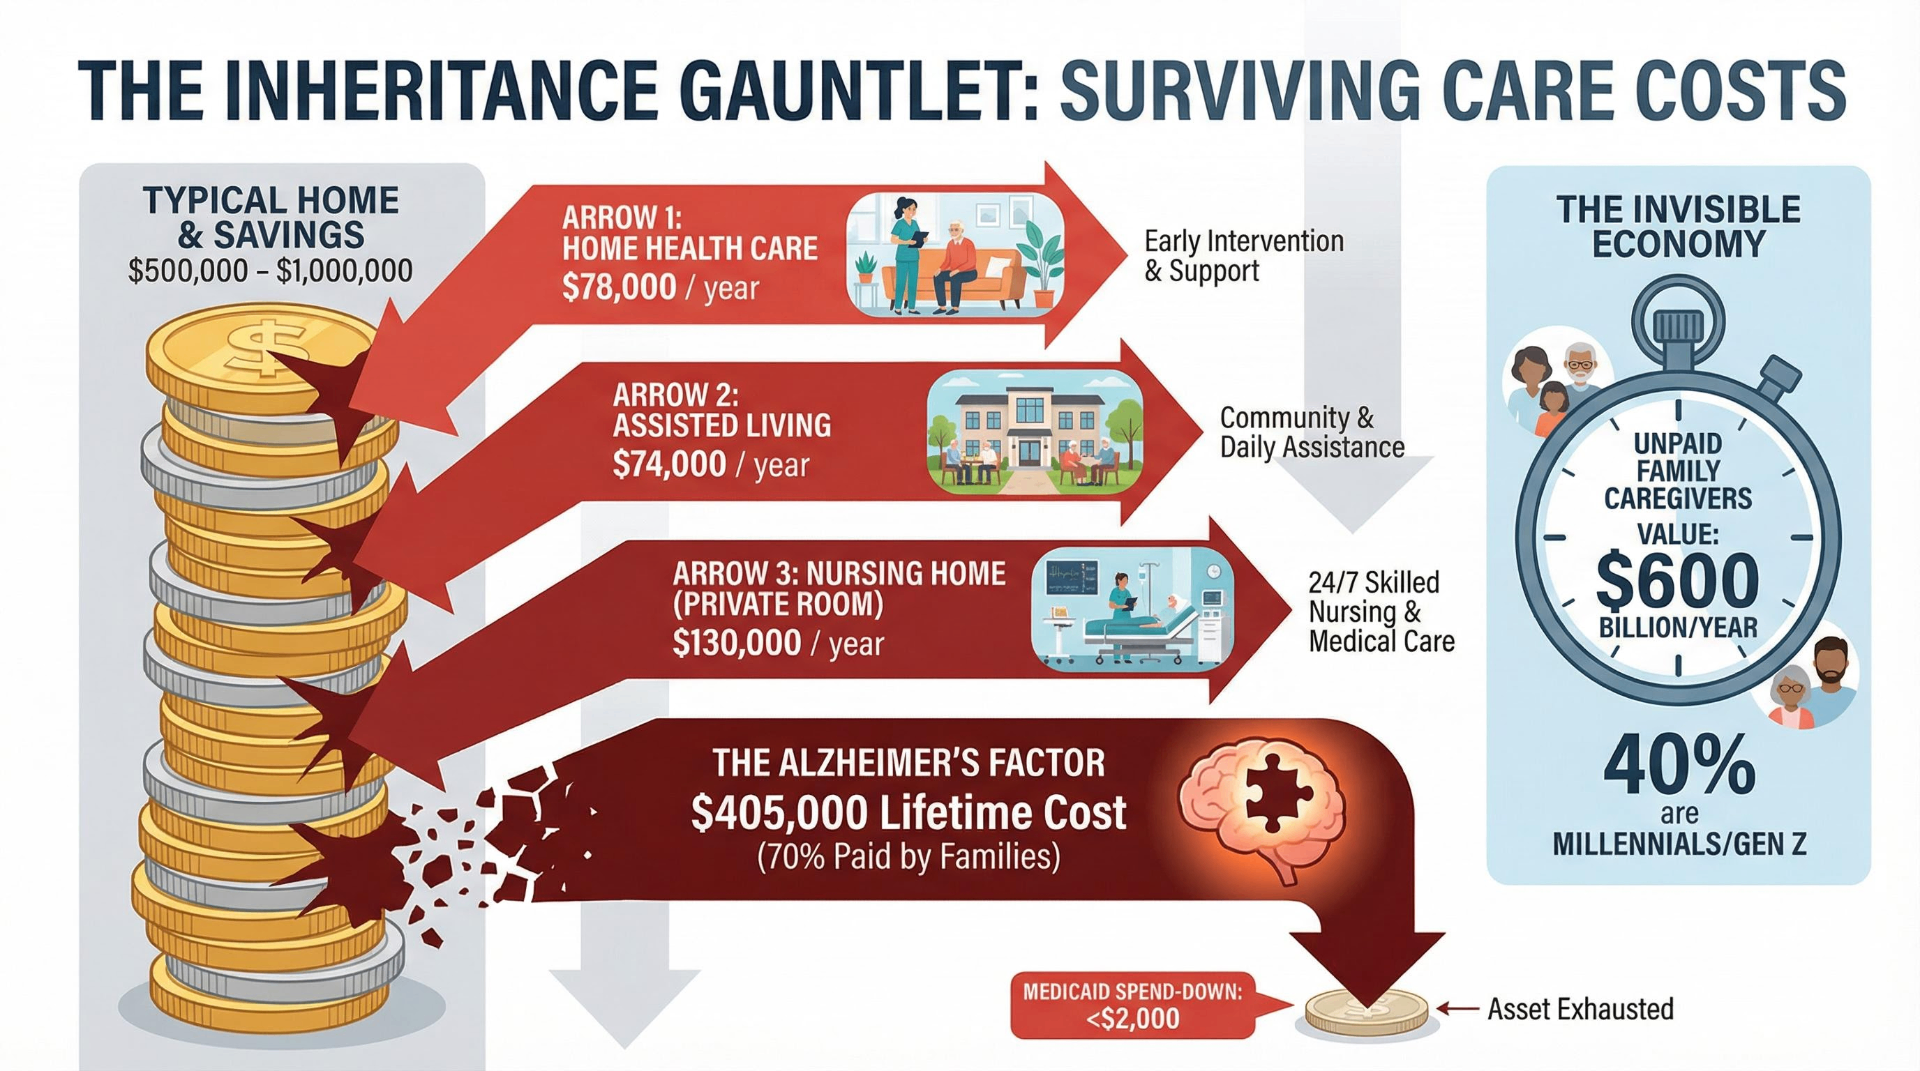
For a 65-year-old retired couple, Fidelity's Retiree Health Care Cost Estimate projects $351,000 in lifetime out-of-pocket health care costs. Nursing home costs can consume $100,000+ per year. Medicaid spend-down requirements force individuals to deplete assets to as little as $2,000 before qualifying for coverage. The result: much of the $124 trillion will be absorbed by the care system before it ever reaches heirs.
Estate Tax Exemptions Just Became Permanent at $15 Million
The anticipated TCJA sunset — which would have cut the federal estate tax exemption from ~$14 million to ~$7 million per individual on January 1, 2026 — was averted by the One Big Beautiful Bill Act (OBBBA), signed July 4, 2025. The law permanently set the lifetime estate, gift, and generation-skipping transfer tax exemption at $15 million per individual ($30 million for married couples), effective January 1, 2026, with annual inflation adjustments beginning in 2027. The federal estate tax rate remains 40% on amounts above the exemption. The annual gift tax exclusion is $19,000 per recipient for both 2025 and 2026.
Section 2: Long-Term Care Costs Are Devouring the Wealth Pipeline
Annual Care Costs Reached New Highs in 2024, Then Stabilized
The Genworth/CareScout Cost of Care Survey — based on 15,000+ surveys from 140,000+ providers — provides the most authoritative annual snapshot. The 2024 survey showed dramatic increases:
| Care Type | 2024 Annual Median | YoY Change |
|---|---|---|
| Nursing home, private room | $127,750 | +9% |
| Nursing home, semi-private | $111,325 | +7% |
| Home health aide | $77,792 | +3% |
| Homemaker services | $75,504 | +10% |
| Assisted living facility | $70,800 | +10% |
| Adult day care | $26,000 | +5% |
The 2025 survey showed meaningful deceleration: nursing home private room costs rose only 1% to $129,575/year, assisted living grew 5% to $74,400/year, and adult day care actually declined 5%. Memory care facilities average approximately $7,505/month or $90,000+/year nationally. For context on the scale of erosion: assisted living costs rose 18.9% between 2021 and 2023 alone.
70% of Americans Over 65 Will Need Long-Term Care
The Administration for Community Living (ACL) at HHS estimates that roughly 70% of people who reach age 65 will need some form of long-term care before they die. Women need care longer (3.7 years) than men (2.2 years). One-third of today's 65-year-olds may never need LTC, but 20% will need it for five or more years.
Yet only ~3% of Americans over age 50 carry any form of long-term care insurance. Most standalone LTCI insurers have stopped selling new policies. The market has essentially failed: KFF reports that 7.1 million people paid LTCI premiums in 2021, but only 80,000 filed claims that year.
Medicare covers virtually none of this. Part A provides skilled nursing facility coverage only under strict conditions — a prior qualifying inpatient hospital stay of ≥3 days, admission within 30 days, and daily skilled care need. Even then, Medicare pays 100% only for days 1–20. Days 21–100 require $209.50/day coinsurance (2025). After day 100, Medicare pays nothing. Medicare never covers custodial care — the very thing most aging Americans need.
Medicaid has become the de facto long-term care program. It is the primary payer for 63% of nursing home residents. Total Medicaid LTSS spending in 2023 reached $257 billion, representing 45.6% of all LTSS expenditures in the U.S. Total national LTSS spending was $563.7 billion — 13.7% of all personal health care spending. However, the House reconciliation bill (2025) targets $880 billion in Medicaid cuts over 10 years, which could fundamentally reshape this safety net.
Alzheimer's Costs $405,000 Per Person — and the Bill Is Growing
The Alzheimer's Association's 2025 Facts and Figures report documents a worsening crisis. For the first time, more than 7 million Americans age 65+ are living with Alzheimer's disease (7.2 million, about 1 in 9 people 65+). This figure could reach 13.8 million by 2060. Roughly 74% of those affected are age 75+, and two-thirds are women.
The total lifetime cost of care per person with dementia is $405,262, with 70% of those costs borne by families through unpaid caregiving and out-of-pocket expenses. Total U.S. dementia care cost $384 billion in 2025, with Medicare and Medicaid covering $246 billion (64%) and out-of-pocket spending reaching $97 billion. Medicare costs for dementia patients are 3x higher than for those without dementia; Medicaid costs are 22x higher. The Alzheimer's Association projects total costs approaching $1 trillion by 2050.
63 Million Family Caregivers Shoulder a $600 Billion Invisible Economy
The AARP/National Alliance for Caregiving report "Caregiving in the U.S. 2025" reveals that 63 million Americans are now family caregivers — nearly 1 in 4 adults and a 45% increase from 2015. The average caregiver is 51 years old, and three in five are women. Critically, 44% provide high-intensity care, 30% have been caregiving for five or more years, and nearly 1 in 4 provide 40+ hours per week.
The economic value of this unpaid labor was estimated at $600 billion in 2021, based on 38 million caregivers providing 36 billion hours at $16.59/hour average. For Alzheimer's and dementia caregivers specifically, nearly 12 million caregivers provided 19.2 billion hours of unpaid care in 2024, valued at $413.4 billion.
The generational dimension is critical. An estimated 10 million Millennials are unpaid caregivers; 73% work a job simultaneously, averaging 21 hours per week on caregiving duties and spending $6,800/year out-of-pocket. Millennial caregivers skew more male (47%) and more racially diverse (over half are people of color) than any previous generation's caregivers. Among Gen Z, 60% of all new caregivers come from this cohort — yet only 3 published studies had examined Gen Z caregiving as of 2024.
The Care Workforce Is 5.4 Million Strong but Needs 9.7 Million Job Fills by 2034
PHI's "Direct Care Workers in the United States: Key Facts 2025" counts 5.4 million direct care workers, including ~3.2 million home care workers (doubled from 1.4 million in 2014). BLS projects 772,000 new direct care jobs from 2024–2034 (the largest growth of any job sector), but accounting for replacements, a total of 9.7 million direct care jobs will need to be filled in that decade — 8.9 million from turnover alone.
The retention crisis is driven by economics: median hourly wage is $17.36 (2024), translating to median annual earnings just under $26,000. Some 36% of direct care workers live in or near poverty, and 49% rely on public assistance. Turnover approaches 100% annually for nursing assistants. The workforce is 85% women, 64% people of color, and 27%+ immigrants.
The CMS minimum staffing rule finalized in April 2024 (requiring 3.48 nursing hours per resident per day) was overturned by a federal court in April 2025, removing the one federal backstop that might have forced wage and staffing improvements.
Washington State Leads; Other States Are Watching
The WA Cares Fund — the nation's first public social long-term care insurance program — is now fully operational. Payroll deductions (0.58% on all wages, no cap) began July 1, 2023, with pilot benefits launching in four counties in January 2026 and statewide benefits available July 1, 2026. The fund accumulated more than $1 billion in its first year of collections. Benefits provide up to $36,500 lifetime (inflation-adjusted). A November 2024 ballot measure to make the program voluntary was defeated 55%–45%.
California (AB 567) has completed actuarial feasibility studies. New York and Massachusetts have authorized funding for feasibility studies. All are watching Washington's implementation closely.
Section 3: The Systems Designed to Support Aging Are Running Out of Time
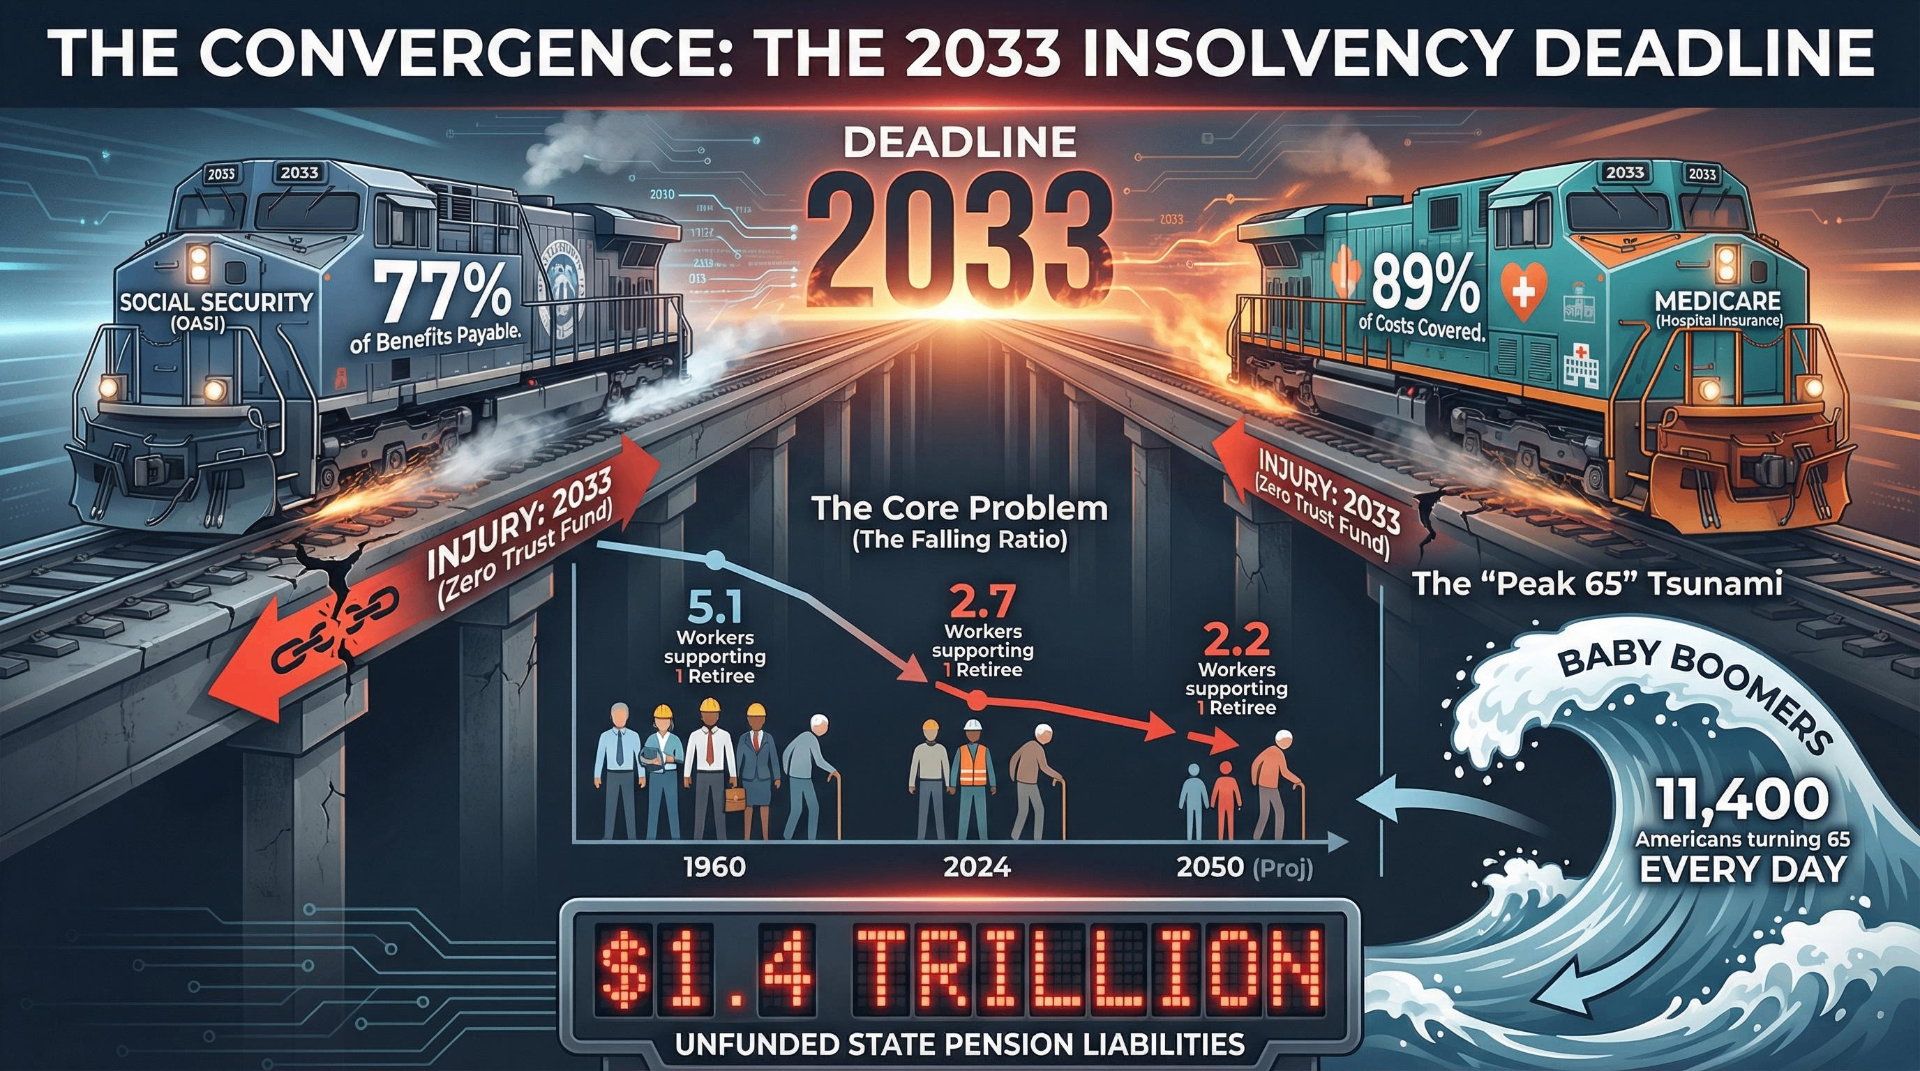
2.7 Workers Now Support Each Retiree — Headed for 2.2
The worker-to-beneficiary ratio stands at 2.7 covered workers per OASDI beneficiary as of 2024, based on 183.9 million covered workers and 67.9 million beneficiaries. This ratio has been in secular decline for decades — from 41.9 in 1945, to 5.1 in 1960, to 3.4 in 2000. It is projected to fall to 2.5 by 2030, 2.3 by 2035, and 2.2 by 2050, eventually reaching 2.0 by 2075.
The "Peak 65" phenomenon is accelerating this: approximately 11,400 Americans turn 65 every day in 2025, a record 4.18 million in a single year. By 2030, all Baby Boomers will be 65 or older. By 2034, older adults are projected to outnumber children under 18 for the first time in U.S. history.
Social Security's OASI Trust Fund Hits Zero in 2033
The 2025 Social Security Trustees Report projects the Old-Age and Survivors Insurance (OASI) trust fund will be depleted in 2033. The combined OASDI trust fund is projected to be depleted in 2034, one year earlier than the 2024 report's projection.
At OASI depletion in 2033, ongoing payroll tax revenue would be sufficient to pay only 77% of scheduled benefits — a 23% across-the-board cut. The 75-year actuarial deficit is now 3.82% of taxable payroll (1.3% of GDP, $23.8+ trillion in present value) — the largest since 1977. The primary driver of this worsening: the Social Security Fairness Act, signed January 5, 2025, which repealed the Windfall Elimination Provision (WEP) and Government Pension Offset (GPO), increasing benefits for ~3.1 million beneficiaries at a CBO-estimated cost of ~$196 billion over 10 years.
As of June 30, 2025, 69.8 million Americans receive Social Security benefits: 55.8 million retired workers and dependents (average retired worker benefit: $2,005/month), 5.8 million survivors of deceased workers, and 8.2 million disabled workers and dependents. Projected beneficiary growth: 81.7 million by 2035 and 88.8 million by 2050.
The Annual Deficit Is $250 Billion and Widening
Social Security's combined OASDI program ran a projected shortfall of $250 billion in 2025. In calendar year 2024, total income was $1.42 trillion against expenditures of $1.485 trillion, producing a net deficit of approximately $67 billion and reducing reserves from $2.788 trillion to $2.722 trillion. Cumulative deficits over 2025–2034 are projected at $3.6 trillion.
To restore 75-year solvency immediately would require one of: a 29% payroll tax increase (3.65 percentage points), a 22% benefit reduction for all current and future beneficiaries, a 27% cut for new beneficiaries only, or some combination. Delaying action until 2034 increases needed adjustments by approximately 15%.
Medicare Part A Moved 3 Years Closer to Insolvency in a Single Report
The 2025 Medicare Trustees Report projects the Hospital Insurance (HI/Part A) trust fund will be depleted in 2033 — three years earlier than the 2036 projected in the 2024 report. This is the most significant single-year deterioration in recent memory.
At depletion, revenues would cover only 89% of program costs. The HI trust fund held $237.5 billion at the start of 2025. Both Social Security OASI and Medicare Part A now share the same projected insolvency year: 2033 — just seven years away.
Immigration Is Social Security's Most Underappreciated Variable
The SSA's sensitivity analysis illustrates immigration's fiscal impact clearly. The base assumption of 1.2 million annual net immigrants produces a 75-year deficit of 3.5% of taxable payroll. A low-immigration scenario (829,000/year) worsens the deficit to 3.9%. A high-immigration scenario (1.7 million/year) improves it to 3.1%. Each additional 100,000 annual net immigrants improves the actuarial balance by approximately 0.1% of taxable payroll. Immigration accounts for nearly one-quarter of the variation in the program's total financial shortfall.
The CBO projects that beginning in 2033, annual U.S. deaths will exceed births, making population growth entirely dependent on immigration. SSA estimates that unauthorized workers have a net positive effect on Social Security financing, paying more in taxes than they receive in benefits.
State Pension Systems Carry $1.4 Trillion in Unfunded Liabilities
The national median public pension funded ratio reached 79% in FY 2024 (up from 75.5% in 2023), but total unfunded liabilities remain approximately $1.37–$1.48 trillion across 47 of 50 states. The most underfunded systems by funded ratio: Illinois (52%), Kentucky (54%), New Jersey (55%), Mississippi (56%), and Connecticut (59.5%). By dollar amount, California leads with $265 billion in unfunded liabilities. Only three states — Tennessee (104%), Washington (102%), and South Dakota (100%) — are fully funded.
Conclusion: The Collision Is Already Underway
The data assembled here tells a single, converging story. The $124 trillion wealth transfer is real in aggregate but deeply misleading at the individual level — the median inheritance is $69,000 (for the minority who receive one at all), it typically arrives after age 51, and it is increasingly consumed by care costs that can exceed $127,000 per year for a single nursing home bed. The care system absorbing this wealth is itself in crisis, with only 3% LTCI penetration, a workforce earning $17.36/hour median with near-total turnover, and 63 million family caregivers — many of them Millennials and Gen Z — performing $600 billion in unpaid labor annually.
The most consequential revision in this data set is not Cerulli's upward adjustment from $84 trillion to $124 trillion. It is the convergence of the OASI and Medicare Part A insolvency dates at 2033 — now just seven years away — combined with the 75-year Social Security actuarial deficit reaching its highest level since 1977. The worker-to-beneficiary ratio's decline from 2.7 today to 2.2 by 2050 is baked into demographics that no policy can quickly reverse. Immigration remains the most potent near-term lever, yet current policy is moving in the restrictive direction.
What emerges is not a wealth transfer but a wealth gauntlet: assets must survive care costs, insurance gaps, workforce shortages, and entitlement erosion before reaching the next generation — if they arrive at all.
Share Your Voice
Join the conversation to share your thoughts and help others understand this topic better.
Join the ConversationCommunity Feedback
No comments yet. Be the first to share your thoughts!