The American Home Slipped Out of Reach
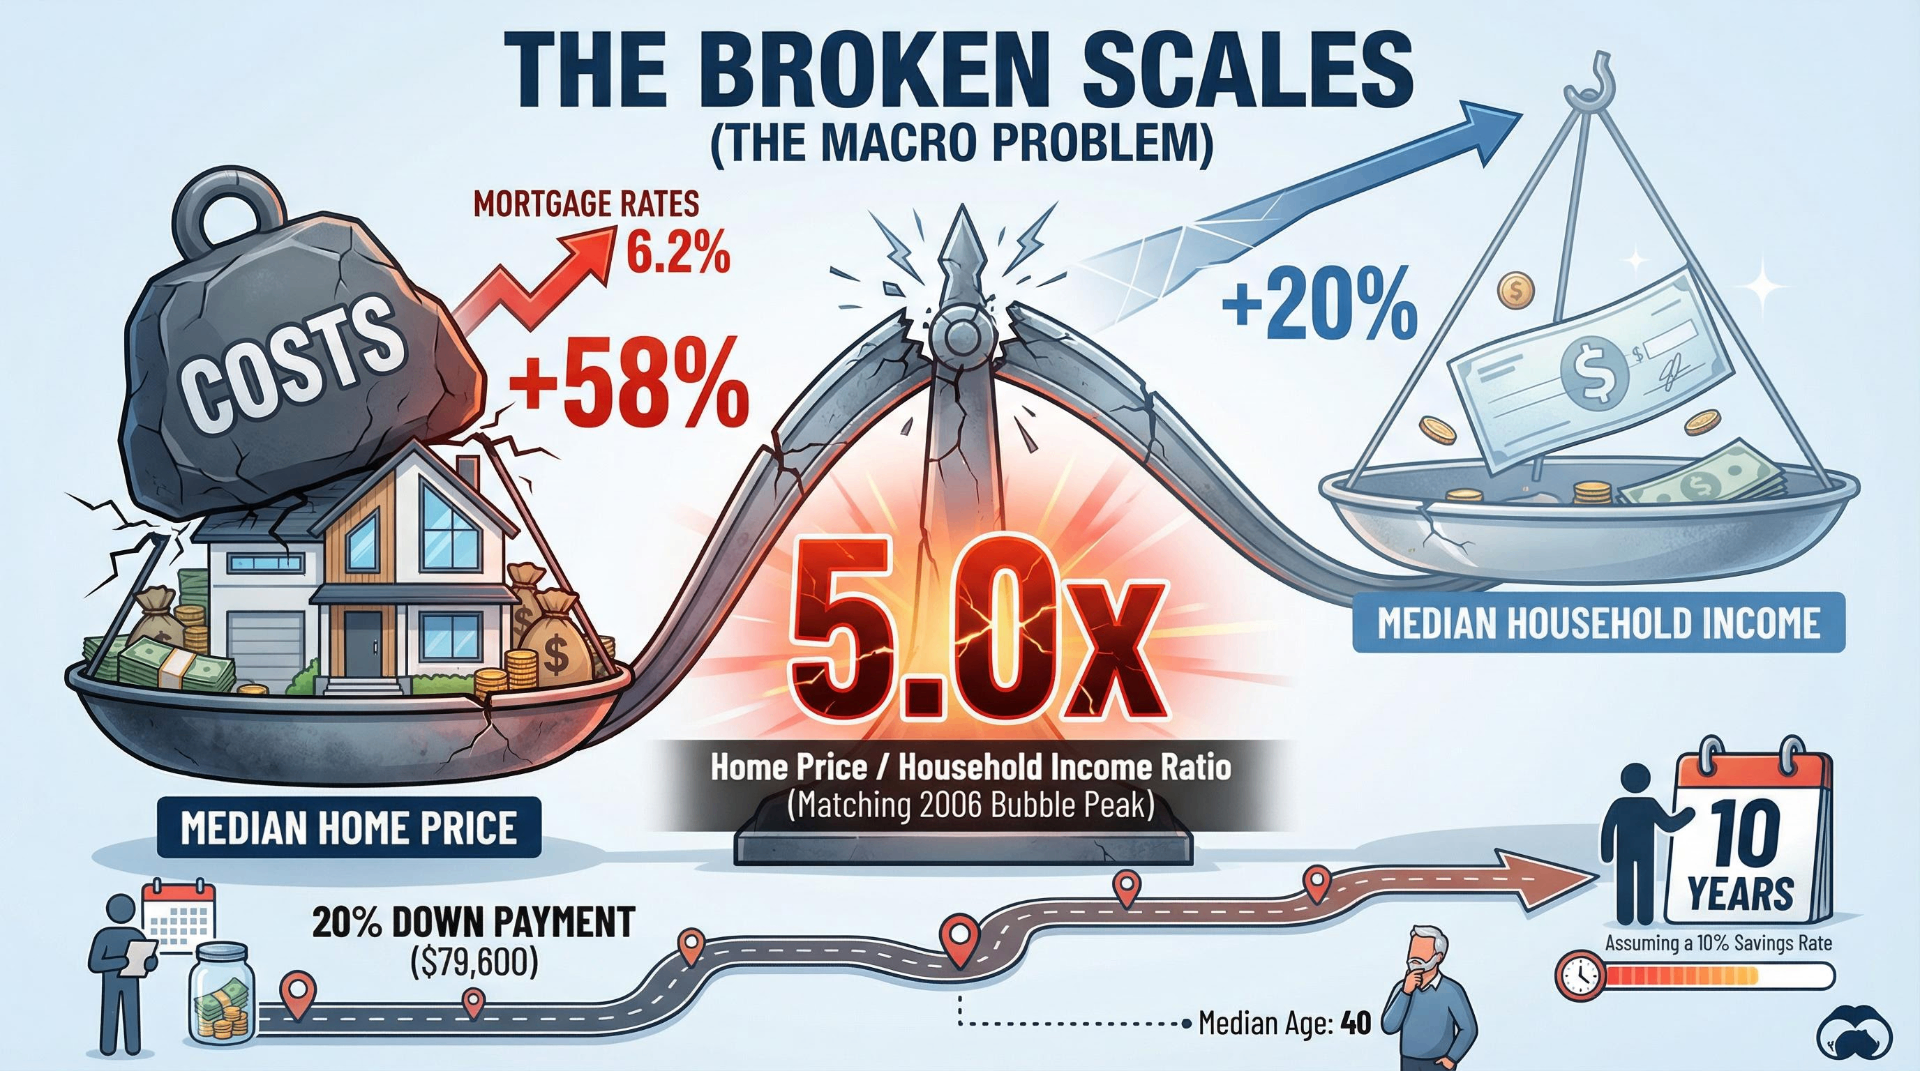
The median American home now costs five times the median household income, matching the peak of the 2006 housing bubble — except this time, the bubble never popped.
The median American home now costs five times the median household income, matching the peak of the 2006 housing bubble — except this time, mortgage rates sit at 6.2% instead of 6.3%, and the bubble never popped. Since early 2020, home prices have surged roughly 50–58% (S&P Case-Shiller National Index, December 2025), while median household income rose just 20% over the same period. That three-to-one gap between housing costs and earnings is the defining economic fact of a generation.
It has pushed the typical first-time homebuyer into their late thirties, driven a third of young adults back into their parents' homes, and turned homeownership from an assumed milestone into something a growing share of Gen Z regard as simply out of reach. At the same time, a rare bipartisan consensus is forming in Congress: the Senate passed its largest housing bill in decades by a vote of 89–10 in March 2026. Whether that political energy translates into real relief is the trillion-dollar question.
Part 1 — The numbers paint a bleak picture
What homes cost now
The national median existing-home sale price stood at $398,000 in February 2026, according to the National Association of Realtors. New single-family homes sold for a median of $414,400 in December 2025 (Census Bureau / HUD). These figures represent a slight cooling from the Q3 2025 single-family peak of $426,800, but they remain staggering in historical context.
Over five years, the Case-Shiller National Index recorded approximately 58% cumulative appreciation from January 2020 to December 2025 — the sharpest five-year run in modern history. Year-over-year growth decelerated to just 1.3% in 2025, which was actually outpaced by 2.7% inflation, meaning real home values technically declined in the second half of 2025 for the first time in years (S&P Dow Jones Indices, February 2026). But that modest correction barely registers against the pandemic-era surge.
Regional divergence has sharpened. The Midwest and Northeast outperformed in 2025, with Chicago (+5.3%) and New York (+5.1%) leading gains on the Case-Shiller index. Sun Belt darlings reversed course: Tampa fell 2.9%, Denver dropped 2.1%, and Phoenix, Dallas, and Miami all posted negative returns. The affordability migrants who flooded these cities during 2020–2022 are now watching prices cool — but not enough to make them affordable.
What rent costs now
National median rent sits at roughly $1,500 for a one-bedroom (Zumper, February 2026), though estimates vary by source and methodology. In specific metros as of early 2026:
| Metro | 1BR Median | Note |
|---|---|---|
| New York City | ~$3,800 | 2BR at $5,070 |
| San Francisco | ~$3,300 | Surpassed NYC for 2BR ($5,120); AI-sector hiring |
| Atlanta | ~$1,600 | Down 4–6% from peak |
| Denver | ~$1,550 | Roughly flat |
| Austin | ~$1,400 | Down 3–6% YoY; supply catching up |
| Cleveland | ~$950 | Down 8%; most affordable major metro |
Cumulatively since 2020, single-family rents have risen 32% nationally, adding roughly $600 per month to the average household's costs (Cotality Single-Family Rent Index, January 2026). In Miami, that cumulative increase reaches 51%. Atlanta renters have absorbed a 59.6% increase since 2020 (LendingTree). One important caveat: Cotality measures single-family rentals specifically. Apartment List, which tracks multifamily units, found rents in early 2026 running only slightly above where pre-pandemic growth trends would have placed them — the spike happened, but some of the excess has unwound in the apartment segment. The two datasets aren't contradictory; they measure different stock. Whether the distinction feels meaningful to a renter paying $600 more than they did in 2020 is another matter entirely.
What people actually earn
Bureau of Labor Statistics data from Q3 2025 shows median weekly earnings for full-time workers by age:
| Age Group | Weekly | Annualized |
|---|---|---|
| Ages 20–24 | $796 | ~$41,400 |
| Ages 25–34 | $1,150 | ~$59,800 |
| Ages 35–44 | $1,385 | ~$72,000 |
| All workers (16+) | $1,215 | ~$63,200 |
Median household income reached $83,730 in 2024 (Census Bureau), the most recent full-year figure. Over the past decade, nominal household income rose about 46% (from $57,230 in 2015). But the Case-Shiller index rose roughly 94% over the same period — housing prices grew at nearly double the rate of incomes. Since 2020 specifically, the ratio is closer to three-to-one. Rents have risen about 1.5 times faster than wages nationally since 2019 (Zillow/StreetEasy).
The price-to-income ratio tells the whole story
The national housing price-to-income ratio has been the single most reliable thermometer for affordability stress. In 2000, only 5 of the 100 largest U.S. metro areas had a ratio above 5.0. By 2022, that number was 48 — nearly half (Harvard Joint Center for Housing Studies). Individual metro ratios are staggering: Los Angeles sits at 12.5×, San Jose at 10.5×, New York at 9.8×.
Nationally, the ratio stands at approximately 5.0× ($416,900 median ÷ $83,730 median household income), matching the 2006 bubble peak. The long-run historical norm hovered around 3.5× through the 1980s and 1990s. The post-crisis trough in 2012 briefly returned to 3.0× before the current surge began.
How long it takes to save a down payment
At the current national median household income of $83,730 and a 10% savings rate, a household sets aside $8,373 per year. A 20% down payment on the median-priced home ($398,000) requires $79,600. That works out to 9.5 years of saving — assuming home prices don't rise further, the saver earns no investment returns, and life doesn't intervene with a medical bill, a job loss, or a child. For a 25-to-34-year-old household earning $80,000, the timeline stretches to 10 full years.
Households currently need to earn approximately $106,700 per year to afford the median-priced home at prevailing mortgage rates — roughly $23,000 more than the median household actually earns (HSH.com / Visual Capitalist, Q4 2025). The median age of a first-time homebuyer reached approximately 38–40 in 2025, depending on methodology — NAR's own survey-based figure of 40 has been questioned for possible response bias toward older buyers; the directional reality is the same regardless. For context, NAR tracked this figure at 29 in 1981.
Mortgage rates: the lock-in effect
The 30-year fixed mortgage rate stood at 6.22% as of March 19, 2026 (Freddie Mac), up slightly from a brief dip to 6.09% in late February. The pandemic-era low was 2.65% in January 2021. Rates nearly tripled in under three years, peaking at 7.79% in October 2023 — the highest in 23 years.
This creates what economists call the "lock-in effect." Existing homeowners who locked in 3% mortgages during 2020–2021 have enormous financial incentive never to sell, which constricts supply and keeps prices elevated. Forecasts from Fannie Mae and the MBA suggest rates will hover in the low-to-mid 6% range through 2028, with Morgan Stanley projecting a possible dip to 5.5–5.75% by mid-2026 if Treasury yields cooperate.
Every major affordability metric — price-to-income, rent-to-wage, down-payment timelines, mortgage costs — is at or near historic extremes. The modest cooling in 2025 did not meaningfully close the gap opened during 2020–2022. For a young household trying to enter the market, the math is harder than it has been at any point in the modern era. That is a structural condition, not a temporary dislocation.
Part 2 — A generation watches the door close
Homeownership rates by generation
The generational homeownership gap is wide and persistent. Redfin's analysis of 2025 Current Population Survey data found:
| Generation | Age Range | Homeownership Rate |
|---|---|---|
| Baby Boomers | 61–79 | 79.9% |
| Gen X | 45–60 | 72.7% |
| Millennials | 29–44 | 55.4% |
| Gen Z | 19–28 | 27.1% |
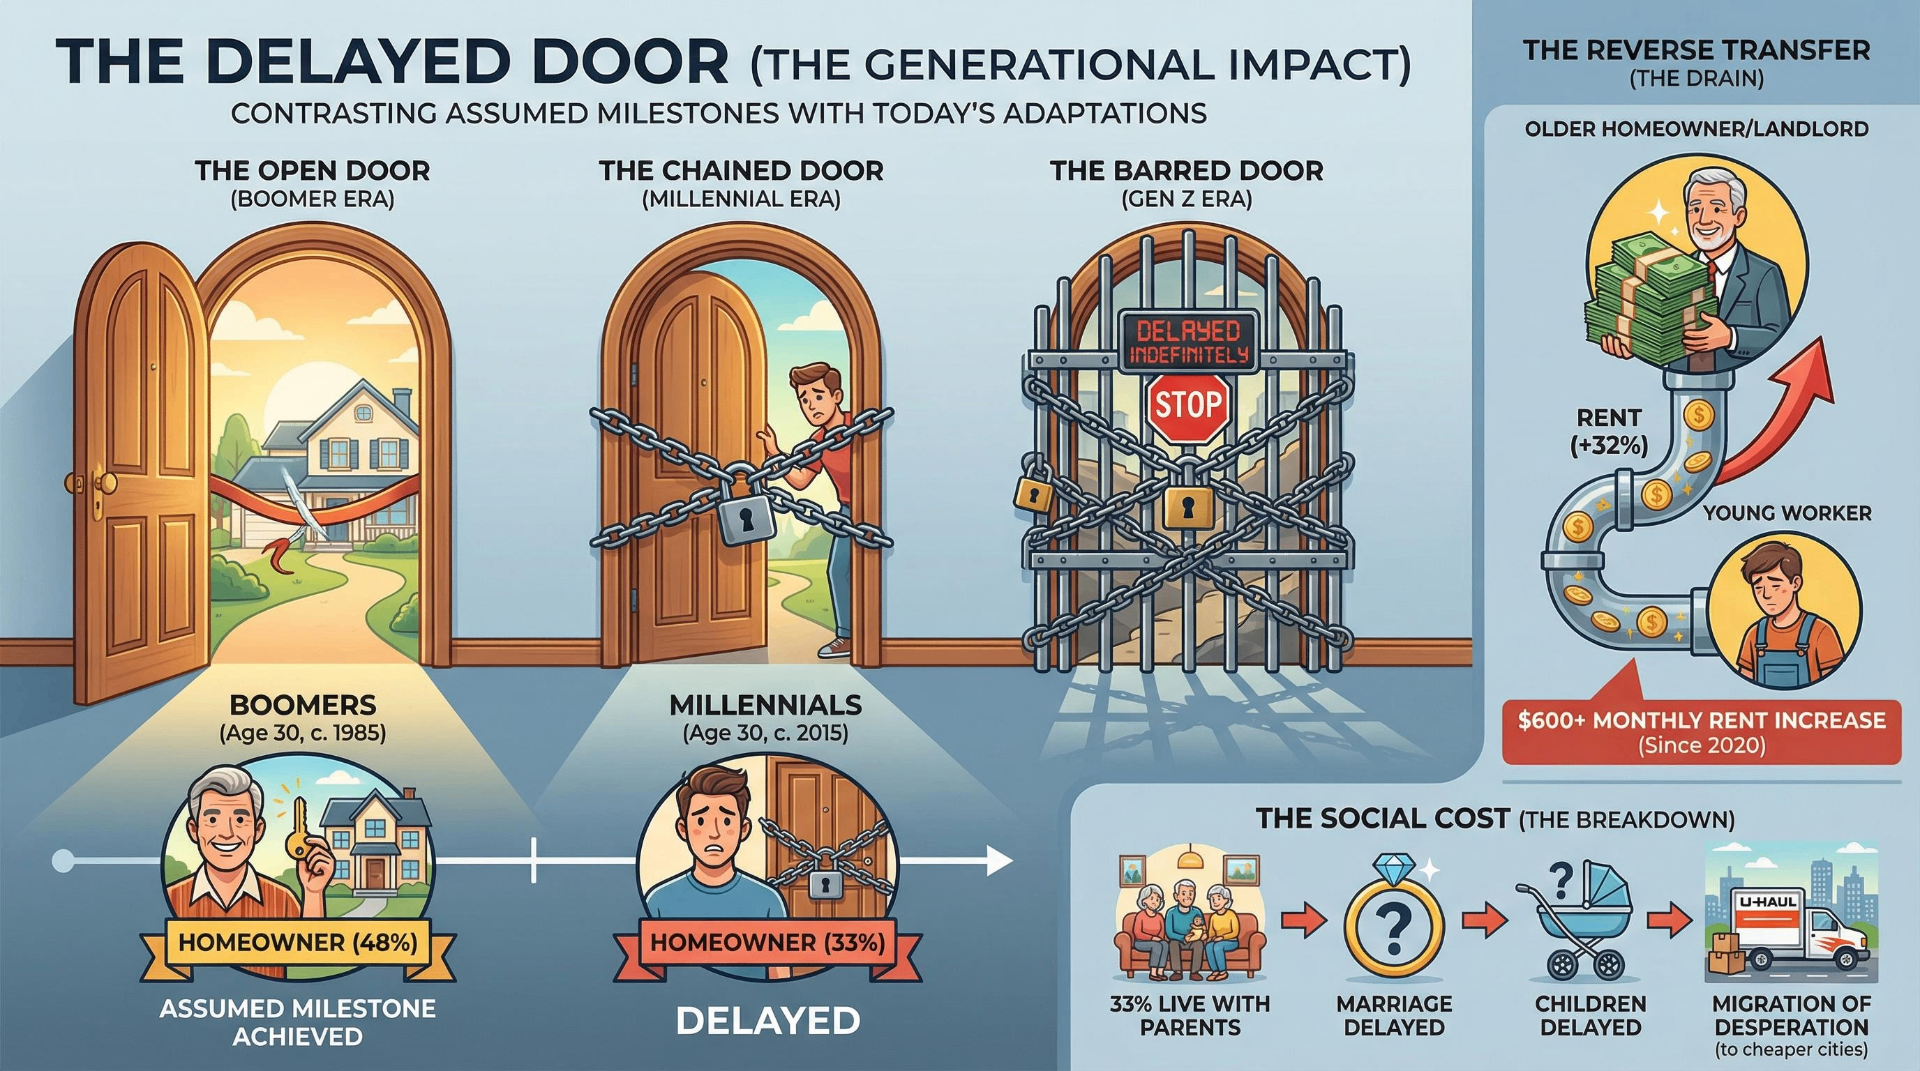
The right way to read these numbers is not to compare Boomers' overall 79.9% against Gen Z's 27.1% — that comparison conflates age with generation. The more honest comparison is age-matched cohorts: at age 30, Baby Boomers had a homeownership rate of roughly 48%. Millennials at the same age: 33% — a 15-point gap (Berkeley Initiative for Young Americans, 2024). The gap does narrow as Millennials age into their late thirties and early forties, but they're running a race that started a lap behind.
Gen Z shows some surprising early momentum. At age 28, their homeownership rate of 38.3% trails Boomers at the same age (44.4%) but runs 1.7 percentage points ahead of where Millennials were at 28 (First American, 2025). This likely reflects pandemic-era low rates and remote-work flexibility that allowed some early Gen Z buyers to purchase in affordable markets. But the window that enabled those purchases has largely closed.
The dream persists, but belief is collapsing
Roughly 90% of Americans across all generations still say homeownership is part of the American Dream (Clever Offers, 2025). The aspiration hasn't died. But the belief that it's attainable is in freefall.
One note on sourcing: several of the statistics in this section come from Clever Offers, a real estate platform that purchases homes from sellers looking for fast cash exits. Their surveys generate useful directional data, but they're produced by a company with commercial interests in housing anxiety. The figures below appear consistent with independent polling trends, but they should be read as market research rather than academic survey work.
79% of Gen Z say they believe they're priced out of homeownership. 49% say it's so far out of reach that there's no point in saving. Among Gen Z non-owners who think they'll never buy, 82% cite inability to afford it — up from 57% just one year earlier (Clever Offers, 2025). Gallup found in April 2025 that 68% of renters say they rent because they cannot afford to buy, up from 45% when they last asked in 2013 — a more methodologically neutral finding from an independent pollster. Northwestern Mutual reported that 53% of non-homeowners believe owning a home will never be financially affordable for them.
Clever Offers also produced a set of extreme responses worth noting with appropriate caution: 21% of Gen Z said World War III seems more likely than buying a home in the next five years; 36% would consider marrying someone primarily to afford a home; 30% have thought about squatting or living in their car out of desperation. These numbers are striking enough that they'll attract skepticism — and they should. But their direction is consistent with what independent researchers have observed. A body of academic work has documented what some researchers loosely term "financial nihilism" among young adults facing extreme unaffordability: a pattern where, when homeownership feels permanently out of reach, some individuals shift toward reduced long-term saving and increased short-term or high-risk spending.
A third of young adults live with their parents
32.5% of adults aged 18–34 lived with their parents in 2024, up from 31.8% in 2023 (American Community Survey / NAHB). Among 18-to-24-year-olds, the figure is 57% (Pew Research). About 1.5 million more adults under 35 live with parents today compared to a decade ago — a 6.3% increase that more than doubles the rate of young adult population growth (Fortune / University of Mississippi).
Multi-generational home purchases hit a record 17% of all home sales in 2024 (NAR), up from 11% in 2021. A Census Bureau milestone report from August 2025 captures the transformation bluntly: less than 25% of 25-to-34-year-olds lived outside their parental home, worked full-time, were married, and had children in 2024. In 1975, that figure was nearly half.
Young adults are voting with their moving trucks
Redfin reported that a record 32.6% of users in 2025 searched for homes in a different metro than where they currently live. The migration pattern is clear: out of expensive coastal metros, into affordable mid-size cities. Miami and Los Angeles led domestic population losses in late 2025 (Bank of America). The winners: Austin, Denver, and Philadelphia for overall population; affordable Midwest cities for relative housing value. Gen Z migration specifically favors Texas, Tennessee, and Wisconsin, drawn by affordable housing, no state income tax, and university-town culture (MovingPlace, 2026). Remote work enables this shift: 25% of all paid U.S. workdays are still performed from home, a figure that has stabilized since 2023 (Stanford / Nick Bloom).
Young Americans haven't abandoned the dream of homeownership — they've lost faith that the dream is meant for them. The data points to a generation that wants what their parents had, understands it may never come, and is restructuring its entire life around that realization: living with parents longer, marrying later, moving to cheaper cities, or simply ceasing to save. This isn't just a housing problem. It's a portrait of a social contract under strain.
Part 3 — Wall Street is buying all the homes (sort of)
What the data actually shows
Few housing narratives generate more heat than "Wall Street is buying up all the homes." The truth is more nuanced than either side typically admits — and the nuance matters for both policy and public trust.
Nationally, large institutional investors (firms owning 100+ homes) hold less than 1% of America's ~86 million single-family homes — approximately 0.35% by AEI and Bank of America estimates (UBS, January 2026). Among the 15.1 million single-family rental properties specifically, institutional investors own roughly 3–3.8% (Urban Institute). Blackstone, perhaps the most politically vilified name in the space, owns about 0.06% of all single-family homes nationally.
But those national averages obscure dramatic local concentration. In Atlanta, institutional investors own approximately 25% of the single-family rental market (GAO, 2024). Jacksonville sits at 21%, Charlotte at 18%. In one census tract in Rutherford County, Tennessee (Nashville metro), seven companies own 19% of the entire housing stock. Roughly 80% of homes owned by firms with 100+ properties are clustered in just 5% of U.S. counties (AEI). The national number is not the story; the local number often is.
| Firm | Homes Owned |
|---|---|
| Invitation Homes | ~85,000 |
| Progress Residential / Pretium | ~83,500 |
| Blackstone (Tricon / Home Partners) | ~62,000 |
| American Homes 4 Rent | ~60,600 |
| FirstKey Homes / Cerberus | ~50,000 |
| Top 5 combined | ~330,000 |
Combined, the top five own roughly 330,000 homes — a large number in absolute terms, but less than 0.4% of total stock.
The narrative is overstated nationally, legitimate locally
When all investors are counted — including the overwhelmingly dominant mom-and-pop landlords with 1–10 properties — investors bought 33.3% of single-family home sales in Q2 2025 (CJ Patrick Co. / BatchData). That figure drove alarming headlines, but small investors account for 91% of all investor-owned homes. Large institutional buyers represented just 2–2.5% of investor purchases (Cotality).
Laurie Goodman of the Urban Institute noted in 2026 that the homes institutional investors buy "are, in general, unlikely to be purchased by owner-occupants otherwise." Banning institutional investors would increase owner-occupant supply by only 1–2%. NYU researcher Joshua Coven estimated that each percentage point of institutional ownership raises prices by 1.7% — meaningful in concentrated Sun Belt markets, but nationally, eliminating all institutional ownership would reduce prices by less than 1.7%.
That said, the counterargument carries real weight in specific zip codes. A GAO review concluded institutional investment "may have contributed to increasing home prices and rents," particularly where concentration is high. In some Atlanta suburbs, institutional investors own 50%+ of actively listed rental homes, giving them market power to push rents above competitive levels. Researchers estimated institutional investors cost potential Atlanta-area homeowners $4 billion in equity between 2007 and 2016, disproportionately impacting Black neighborhoods. Corporate landlords also filed nearly 15,000 eviction actions during the pandemic federal moratorium (Congressional investigation, 2022). These are documented harms that deserve regulation on their own terms — even if the national affordability math doesn't change much.
The industry is already shifting
Perhaps the most underreported development: all four largest single-family rental landlords have been net sellers of existing homes for six or more consecutive quarters through Q3 2025 (Parcl Labs). Institutional purchases are down over 90% since 2022 (Blackstone). The industry is pivoting to build-to-rent — constructing new homes specifically for rental, which represented 7.2% of all single-family starts in Q2 2024.
This pivot complicates the political narrative. Congress is poised to ban something the industry is already largely doing less of, while build-to-rent actually adds to housing supply. The 21st Century ROAD to Housing Act, which passed the Senate 89–10 in March 2026, bans large institutional investors from purchasing existing single-family homes but includes exceptions for build-to-rent and renovation, with penalties up to $1 million per violation.
The "Wall Street bought all the homes" narrative captures a real grievance in specific markets, but misidentifies it as a national cause. The 4-million-home deficit is the main character. The political energy devoted to this issue is disproportionate to its supply-side impact. That said, the eviction patterns, equity displacement, and market concentration documented in specific communities represent genuine harms that regulation can and should address — just not with the expectation that doing so will make houses affordable.
Part 4 — The policy landscape is finally moving, unevenly
A historic bipartisan bill — and a conflicted executive branch
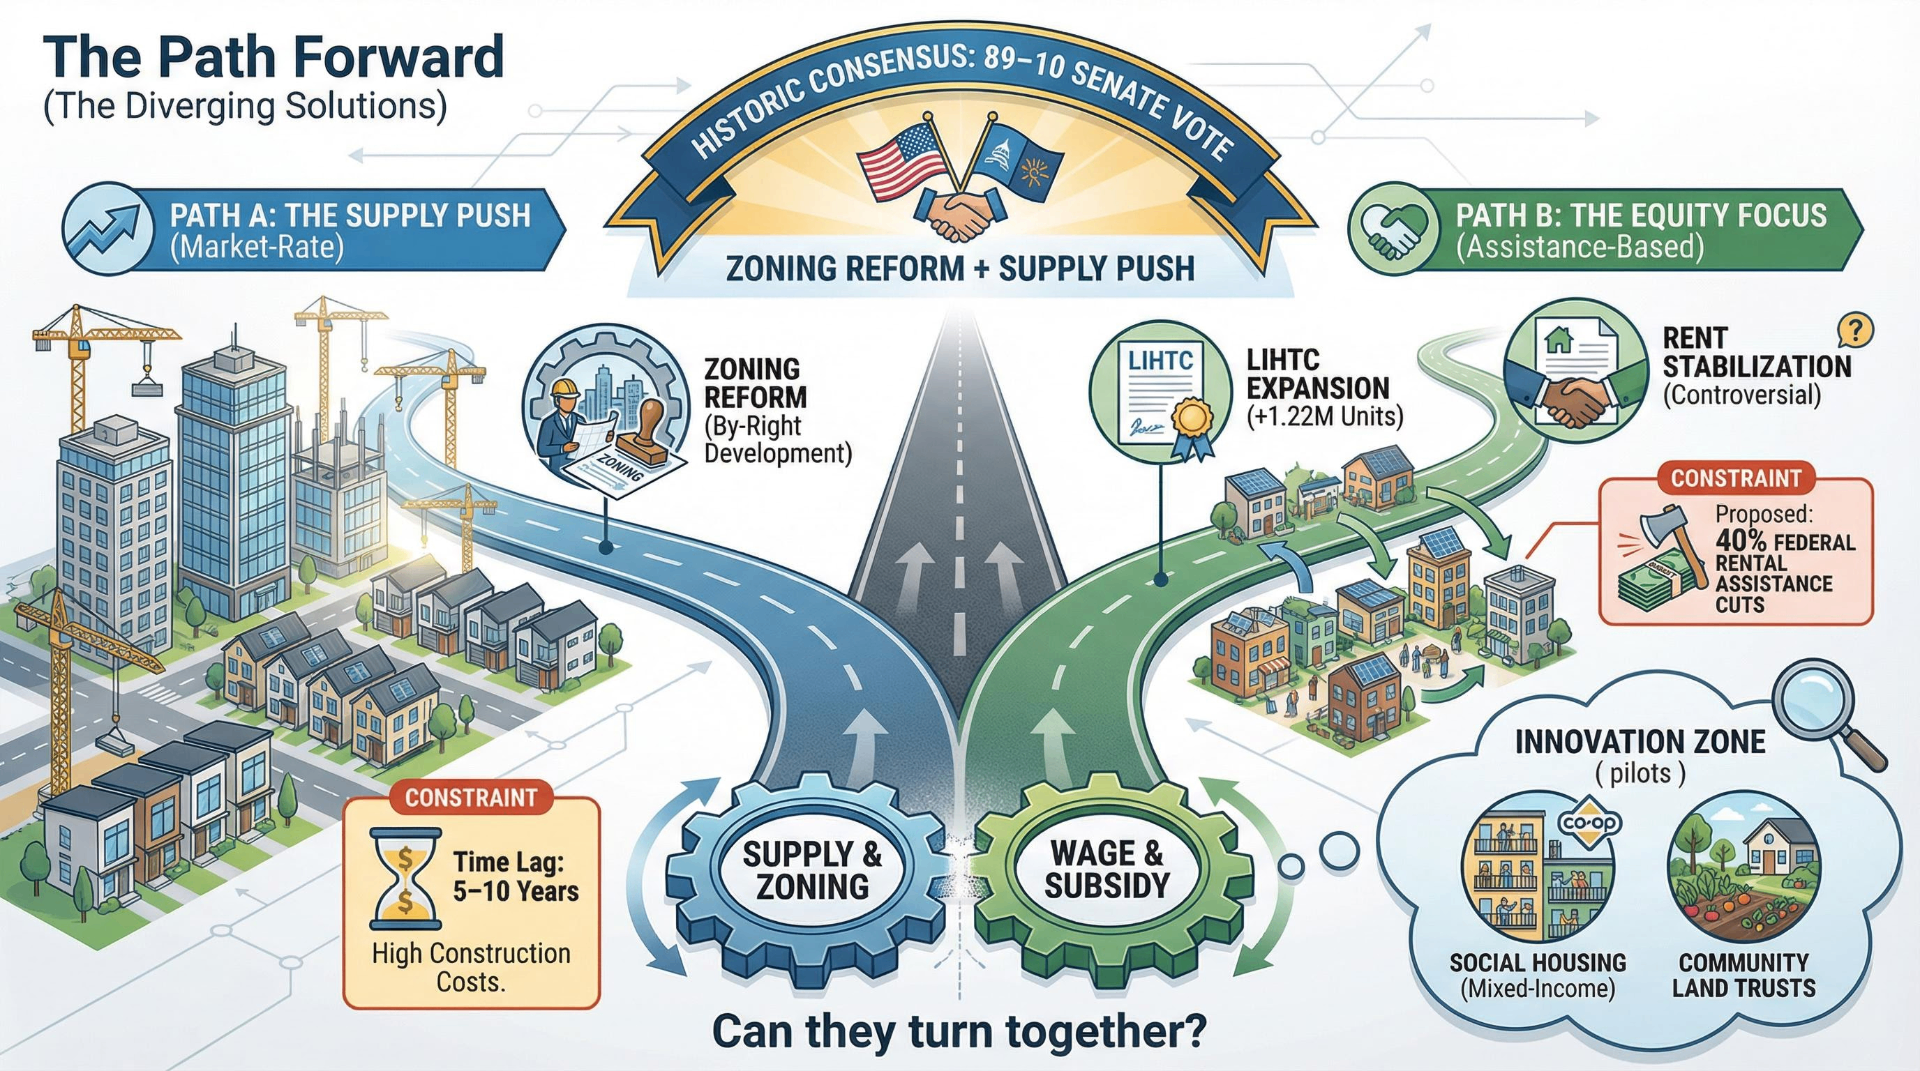
The most significant federal housing development in decades is the 21st Century ROAD to Housing Act, shepherded through the Senate Banking Committee by Republican Tim Scott and Democrat Elizabeth Warren. It passed the House 390–9 in February 2026 and the Senate 89–10 in March 2026 — margins that suggest genuine, durable political consensus rather than a partisan photo-op. The bill incentivizes local zoning reform, lifts caps on HUD's Rental Assistance Demonstration program, exempts urban infill from NEPA environmental review, prioritizes transit funding for pro-housing areas, removes the chassis requirement for manufactured homes, and increases the banking public welfare investment cap from 15% to 20%.
Also working in the supply direction: the One Big Beautiful Bill Act (signed July 4, 2025) included the most significant expansion of the Low-Income Housing Tax Credit in over 25 years — a permanent 12% increase in 9% LIHTC allocations and a permanent reduction of the private activity bond threshold from 50% to 25% for 4% LIHTC projects. Novogradac estimates these provisions could finance 1.22 million additional affordable rental homes over the next decade.
Working against all of this: the Trump administration's FY2026 budget proposes cutting federal rental assistance by roughly 40%, block-granting Section 8 to states and imposing a two-year cap on assistance for able-bodied adults. The National Low Income Housing Coalition estimates the affordable housing deficit for extremely low-income renters stands at 7.1 million homes. Federal spending cuts would widen it. The LIHTC expansion addresses the middle of the market. Neither addresses the same population. This tension — supply-side momentum combined with demand-side cuts — defines the federal housing policy environment in early 2026.
It is also worth being direct about what supply-side solutions don't address: wage growth. This entire report documents a gap between housing costs and incomes that has widened over a generation. Zoning reform, LIHTC credits, and manufactured housing modernization will increase supply and theoretically reduce prices over time. But for the bottom third of income earners, even moderately reduced prices don't close the affordability gap without parallel attention to wages, rental assistance, or both. That's the piece the current bipartisan consensus largely leaves on the table.
Zoning reform is having its moment
The YIMBY movement achieved its most significant legislative victory when California Governor Newsom signed SB 79 in October 2025, allowing apartment buildings up to nine stories by-right within a quarter-mile of heavy rail stations in eight urbanized counties. Newsom also signed bills exempting most urban apartment projects from CEQA environmental review, fast-tracking ADU construction, and allowing third-party building plan checkers.
Beyond California: Cambridge, Massachusetts passed reforms allowing apartments up to four stories citywide. Oregon's 2019 elimination of single-family-only zoning continues producing new duplexes and triplexes. Minneapolis's 2040 plan eliminating single-family zoning remains in effect. Montana and New York City have both made meaningful zoning code changes. The Berkeley Othering & Belonging Institute tracked 162 reform efforts across 109 municipal jurisdictions as of February 2025, with ADU reform as the most common type.
Worth noting the supply skeptic's honest pushback: California has been passing pro-housing legislation for six consecutive years, and housing costs there remain among the nation's highest. Zoning reform is necessary but not sufficient — construction costs, financing costs, and the time lag between approval and occupancy mean the supply benefits of reforms passed today may not be fully felt for five to ten years.
Rent control: expanding but controversial
Washington State became the latest to enact statewide rent stabilization in May 2025, capping annual increases at 7% plus CPI or 10%, whichever is lower, with a 12-year new-construction exemption and a 15-year sunset. Oregon's pioneering 2019 statewide cap (7% + CPI) and California's AB 1482 (5% + regional CPI) remain in effect.
The cautionary tale is St. Paul, Minnesota, where voters approved an aggressive 3% cap with vacancy control and no exemptions in 2021. New housing permits dropped 80%, and the city significantly rolled back the law in 2022. Permits recovered after the rollback.
More recent and methodologically rigorous work by Diamond, McQuade, and Qian (2019, Stanford) found that expanding rent control in San Francisco led to a 15% reduction in renters in regulated buildings and a 7% increase in citywide rents, as landlords converted units or demolished them. Modern "second-generation" rent stabilization — with inflation-adjusted annual caps, new construction exemptions, and vacancy decontrol — is less distortionary than old-school price freezes, but the fundamental supply-side concern persists.
Alternative models gaining traction
The most intellectually interesting housing policy development may be the growing serious interest in social housing — publicly developed or co-owned mixed-income housing designed to be permanently affordable. Montgomery County, Maryland's Housing Opportunities Commission has become the leading U.S. model, using a $100 million revolving fund to develop mixed-income projects where 30% of units are permanently below market. By eliminating private equity's demand for mid-to-high-teens annual returns and accepting a 5% return instead, the model reduces development costs by tens of millions per project.
Seattle voters approved a 5% payroll tax on salaries exceeding $1 million in February 2025, expected to generate $52 million annually for a new social housing development authority. Community land trusts now number over 300 active organizations nationally, a 25% increase from five years ago, with HUD allocating $35 million for CLT capacity-building grants in 2025 — the first dedicated federal CLT funding stream in over a decade.
The honest caveat: these are promising pilots, not proven systems at scale. Vienna built its social housing stock over a century with consistent public investment and political will. American cities starting from scratch face different land costs, construction costs, and political durability questions. The models are worth pursuing and funding. Whether they can operate at the scale the crisis demands remains genuinely unproven.
Where this leaves us
The American housing crisis is not one problem but several interlocking failures compounding over decades. Restrictive zoning limited supply. Pandemic-era monetary policy inflated prices. Wage growth failed to keep pace. Institutional investors amplified distortions in specific markets. And the result is a country where the median household cannot afford the median home — where a 25-year-old saving diligently won't accumulate a down payment until their mid-thirties, where a third of young adults live with their parents not by preference but by necessity, and where the phrase "starter home" has become almost ironic.
The most underappreciated dimension of this crisis is the reverse wealth transfer already underway. Rather than building equity through homeownership as their parents did, young adults are transferring wealth to existing homeowners and landlords through ever-rising rents. Every year of delayed homeownership represents lost equity accumulation that compounds over a lifetime. Researchers project that cohorts born in the 1990s will have homeownership rates roughly 9.6 percentage points lower than their parents at retirement — a gap that will express itself in retirement insecurity, reduced intergenerational wealth, and widening inequality for decades to come.
What the research ultimately reveals is not a shortage of solutions but a shortage of political will to deploy them in combination. Zoning reform, LIHTC expansion, social housing investment, community land trusts, manufactured housing modernization — these are not untested theories. Some version of each is working somewhere. The Senate's 89–10 vote on the ROAD to Housing Act suggests the political consensus for supply-side action may be finally arriving. Whether it arrives fast enough, and whether it extends to the wage and subsidy dimensions that the supply consensus tends to leave behind, will determine whether the housing market of 2035 looks like the one of 2005 or the one of today.
Note: This research report was developed as a standalone data and narrative resource for the Between Silicon and Soul Affordability Crunch section. The "Tyler" scenario, survival calculator, and Three Paths Forward probability estimates on the main page reflect editorial framing that predates this research update; readers may want to revisit those probability estimates in light of the March 2026 legislative developments documented here.
Share Your Voice
Join the conversation to share your thoughts and help others understand this topic better.
Join the ConversationCommunity Feedback
No comments yet. Be the first to share your thoughts!